
WordPress has recently added a new page to their dashboard to help end-users self-service their site in case there are any configuration issues present that could be causing problems that otherwise would go unnoticed. It’s designed to help keep your site healthy so it can be the best it can be, whilst also help provide a convenient location to help developers with debugging. This guide will show you how to access and use this new page.
Accessing Site Health Check
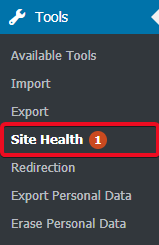
1. Access the Tools section of your site and click on Site Health to access the tool.
Using Site Health Check
The tool uses four different tabs to help navigate the interface.
Status
This displays to the user information to help summarise the current status of the site after running some tests on it. Any issues with the way WordPress and its plugins have been configured can be viewed here, as well as the tests that have been passed if you have implemented some of the key aspects already.
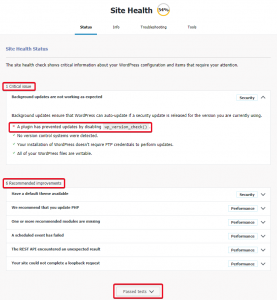
As you can see as an example, there is only one critical issue displayed here on the WordPress site in question. wp_version_check() has been disabled, preventing automatic updates from occurring. A plugin enabled on the site is causing this, so the best way to resolve it would be to find the plugin and see what setting is causing this.
The recommended improvements are exactly that and aren’t necessarily an immediate requirement to be remediated. You can check each individual issue by clicking the arrow on the far right, which will help provide more information regarding what improvements can be made.
Info
The Info tab can be used to display more details regarding the site’s configuration and summarise them on a single page. This can be useful for debugging work if you’re having some configuration issues on your site.
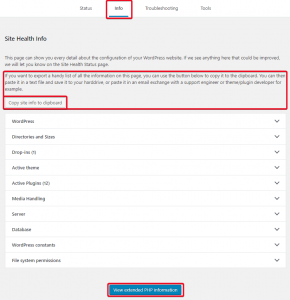
You can copy the full information quickly using the Copy site info to clipboard button. This will allow you to export and paste it to a .txt file or similar if you wish, as well as paste it into any forums or support areas if you’re needing to share the information with a developer to help troubleshoot issues. Below you’ll see a brief overview of what each drop down menu contains.
WordPress: This drop down menu displays information regarding things like what WordPress version your site is using, the language it is set to, the home/site URL and whether HTTPS is being used. It essentially summarises the settings your WordPress installation is currently using.
Directories and sizes: This displays the location of your WordPress installation, the size of the directory it is located in, where your uploads directory is located as well as its size. You can also see the same information for your themes and plugins directories, as well as your database’s size and the accumulated total size of the entire installation.
Drop-ins: A drop-in is a single file that replaces or enhances WordPress’ features in ways that are not possible via traditional plugins. You can view which ones you have currently here, with the most common files being ones to help with caching.
Active Theme: This provides information regarding the theme that is currently active on your site including the name, version number, author, the features it contains as well as which directory the theme is stored in.
Active Plugins: Here you can see listed all of the active plugins on your site, as well as their version number and the name of the author.
Media Handling: WordPress can be set to use specific media handlers. This menu will show you the editor you currently have active as well as information regarding ImageMagick if you have it enabled.
Server: This is useful for displaying information regarding the server your site is hosted on. It’s also useful for comparing developer environments and certain configurations if you’re making changes to your site. You can see the web server software, the PHP version your site is running, as well as a bunch of other technical details that may be required for configuring or troubleshooting your site.
Database: If you wish to see the configuration details of your database, you can do so using this drop down menu. It will show you the extension used, the server and client version, as well as the user, host, name and prefix of your database. This would be useful when making any changes to your site’s database, or if you’re wishing to view its configuration.
WordPress constants: This shows where certain settings for your site are loaded from, which can help with debugging and troubleshooting.
File System Permissions: These indicate what your important directories are set to and whether they are writable to via your WordPress installation.
View extended PHP information: This button at the bottom of the page generates an info.php page to show you more details regarding your current PHP configuration on the server. This is incredibly useful for debugging, and also acts well in preventing you from accidentally leaving your own info.php page publicly accessible via your site!
Site Health Check and Troubleshooting Plugin
If you have the Site Health Check and Troubleshooting plugin installed on your WordPress site, it will add some additional features to help you with debugging and troubleshooting your site if any issues arise. These can be seen below.
Please note: These next couple of features will only be present if you have the plugin installed. You can read up on how to use the full plugin using one of our other guides.
Troubleshooting
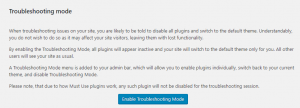
The troubleshooting tab allows you to find the button to enable troubleshooting mode. This mode sets all plugins to inactive and sets the theme to its default one. The great thing about this is that it only happens for you, with your site’s visitors and users still seeing everything as they normally would. You can manage plugins and themes in this mode without interfering with the front end of your site, disabling/activating them as you please. Simply click the Enable Troubleshooting Mode to start troubleshooting.
Tools
There are two internal tools included with the Site Health Check system. They’re designed to create a convenient way to check a couple of issues in case they aren’t working as expected.
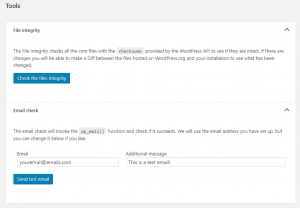
File Integrity Checker: This tool is incredibly useful when you believe you have a compromised site. The core files of WordPress have their own unique checksums (a sequence of numbers and letters) that are calculated via complex algorithms. The WordPress API will provide these checksums to compare to your own site’s core files. If the calculated checksum of your files are different to the API’s, it will notify you and allow you to perform a diff check to see what the text based differences are. A lot of compromises will appear to be random letters and numbers to try and hide it from plain sight and scans. This is just standard characters encoded in Base64 a lot of the time. Any code that looks suspicious in your files is best off being removed and any new files/directories you notice that have been created recently are best to look into as well. We do have a guide that will help you to recover if you believe your site has been compromised. Using the file integrity checker should help you clean things up if they are messy. All you need to do is click Check the Files Integrity and it’ll do all the work for you when it comes to finding potentially compromised files.
Email Check: You can use this tool to make sure WordPress and its plugins can send emails properly. It’s useful for troubleshooting issues regarding email notifications and so forth. It’s also useful to make sure none of them go to your spam folder. It essentially checks whether the wp_mail() function is working properly or not.
Classification: Public
Last saved: 2019/08/14 at 15:31 by Jamie