
![]()
WP_Debug is a built in debugging tool that when enabled, will display any PHP errors on the front-end of your WordPress website. This tool is ideal for debugging the infamous WordPress white page of death and other coding related issues.
In this quick and easy guide, we will show you how to enable the WP_Debug feature and output the results to a log file.
Debugging with WP_DEBUG
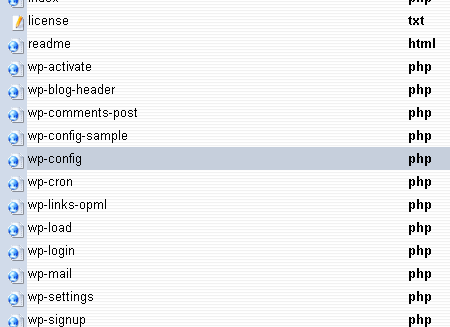
1. Navigate to your wp-config.php file located in the domains root folder. This can be found through your FTP Client.
2. Open the wp-config.php file and add
define( 'WP_DEBUG', true );
For ease, I have put mine just below
* @package WordPress
*/
It should now look like this:
* @package WordPress
*/
// Enable WP_DEBUG mode
define( 'WP_DEBUG', true );
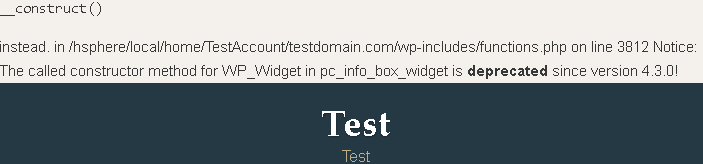
3. Now go to your website. If any errors are being generated, then they will show at the top of the page. See the example image:
Logging Errors with WP_DEBUG_LOG
Another handy tool is WP_DEBUG_LOG, which can be used in conjunction with WP_DEBUG to save all error messages to a debug.log file located in the /wp-content/ directory of your site.
-
- To turn on debug logging, simply add the following line of code to your wp-config.php file.
// Enable WP_DEBUG_LOG mode
define('WP_DEBUG_LOG', true);
- Once you have done this, if you navigate to /wp-content/debug.log in your FTP Client, there will be a list of errors displayed. This is especially useful if you want to review any errors later.

Now you can easily see these errors, you can then go about fixing them.
WP_DEBUG is the go to debugging tool for WordPress and will display all errors, notices and warnings.
We’ve covered the basic debugging and outputting the results to log file in this post but for the full functionality of the WP_DEBUG feature please see the WordPress codex.

Classification: Public
Last saved: 2019/08/14 at 15:12 by Jamie