
LVE is a kernel level technology developed by the CloudLinux team. The technology has common roots with container based virtualisation and uses cgroups in its latest incarnation. It is lightweight and transparent. The goal of LVE is to make sure that no single web site can bring down your web server. As misuse from a single domain can result in an entire server grinding to a halt, domain utilisation must be plateaued to ensure all shared customers receive a smooth service. LVE provides Pipe Ten with the ability to do this, as well as the ability to feed important graphs to the customer regarding their resource utilisation. LVE works on a per account basis.
Where do I view my LVE graphs?
To view your graphs, login to your account via my.pipe.co and press on the orange Graphs button.
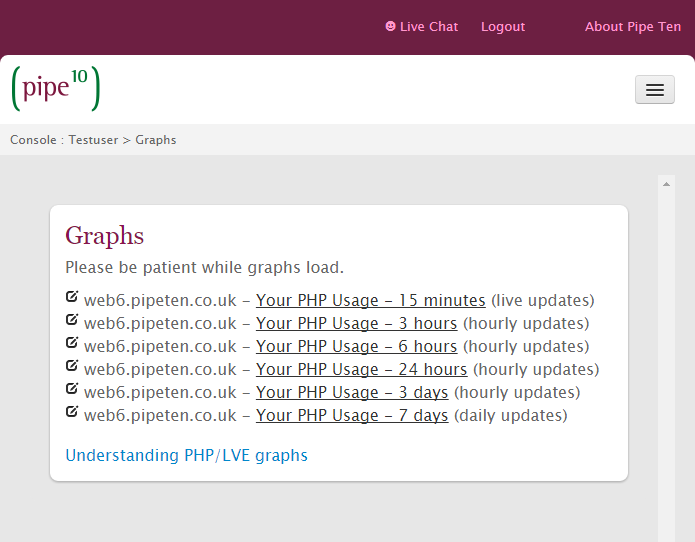
As can be seen, the graph summaries are split into 6.
- Your PHP Usage – 15 Minutes
- Your PHP Usage – 3 Hours
- Your PHP Usage – 6 Hours
- Your PHP Usage – 24 Hours
- Your PHP Usage – 3 Days
- Your PHP Usage – 7 Days
Each option will provide you with a breakdown of your resource utilisation in the form of graphs.
What do the graphs mean?
CPU Usage
CPU usage shows you what percentage of your allowed processing you are running at. Any processes that attempt to exceed the allowed limit will be throttled to prevent excessive use of your allowed CPU cores.
An example of good CPU utilisation can be seen on the left, while bad utilisation can be seen on the right.
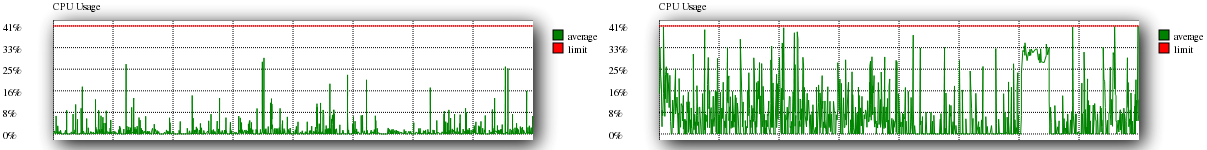
As can be seen from the good graph, typical usage will have many peaks and troughs, however utilisation should never reach max as it does within the Bad example.
Virtual Memory Usage
Virtual memory usage shows the volume of VMEM that your account is utilising over a period of time. High usage typically occurs due to excessive use of PHP processes; Checking for any applications that are using excessive memory can point you in the right direction as to what my be using to much virtual memory.
An example of good virtual memory can be seen on the left, which bad utilisation can be seen on the right hand side.
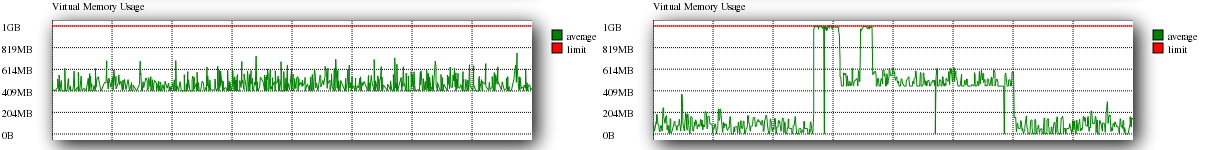
As can be seen from the good graph, virtual memory should not have too large a utility, whereas large and multiple peaks implies bad use of PHP processes.
Physical Memory Usage
Physical memory usage shows you the actual volume of memory that is in use by your account over a period of time, and will determine the volume of intensive calls to the web server as well as large volumes of caching.
An example of good physical memory usage is shown below on the left, while bad utility can be seen on the right.
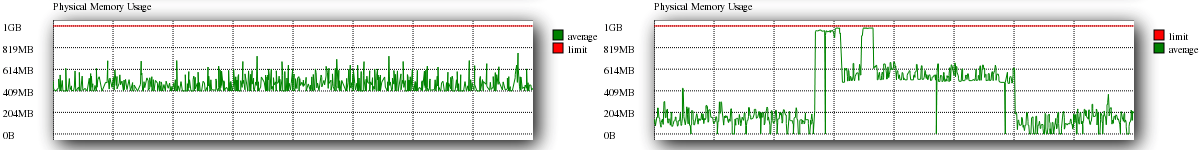
Again, within the good example shows that you should not be peaking to the physical memory limit, multiple times as is shown in the bad example
Input/Output Usage
The Input/Output usage shows what volume of data is being called directly from the hard disk. Excessive use of I/O will simply buffer the disk calls resulting in slower performance.
Both good and bad examples are shown below.
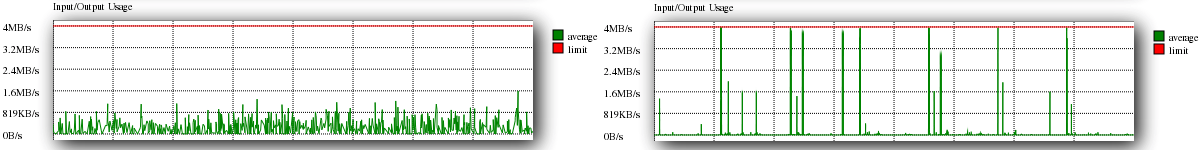
As can be seen from the bad example, excessive I/O calls are being made, implying that a lack of caching is taking place, however in some circumstances moderate to high Input/Output usage can be deemed beneficial depending on your other utilisations.
Input/Output Operations
Input/Output operations display the volume of physical operations being carried out at a given time by the hard disk. Excessive I/O operations will simply buffer the disk calls resulting in slower performance.
A good example of IO operations can be seen on the left, while a bad example is shown on the right.
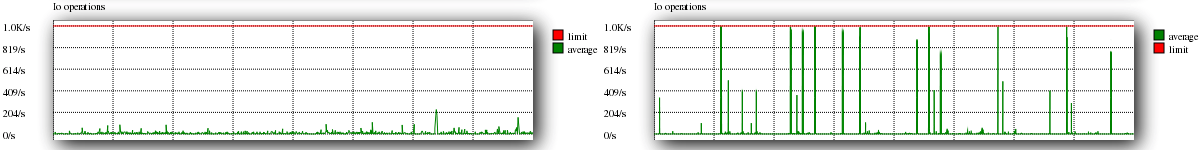
Similar to Input/Output Operations above, excessive I/O calls imply a lack of caching on the website.
Entry Processes
The entry processes are limited by LVE to prevent excessive HTTP access within a time frame. By monitoring entry processes you can identify times of excessive traffic.
A good example of this can be seen on the left, as well as a bad example on the right.
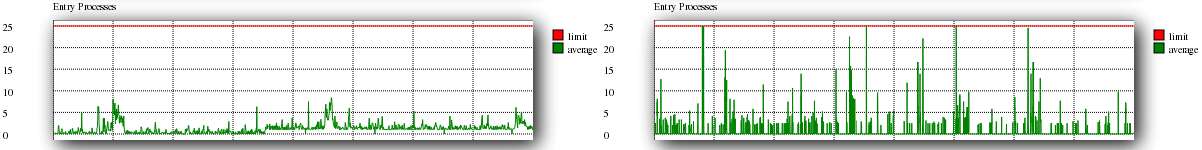
The bad graph show how the entry processes spike to the limit. This happens when when there is excessive HTTP request for CGI/PHP within a time frame.
Processes
The Processes show the total number of processes within LVE. There is a limit set so that once it is reached, no new process can be created (until another one dies). When that happens, the processes counter is incremented. Apache might return 500 or 503 errors in such case.
Good and bad examples are shown below.
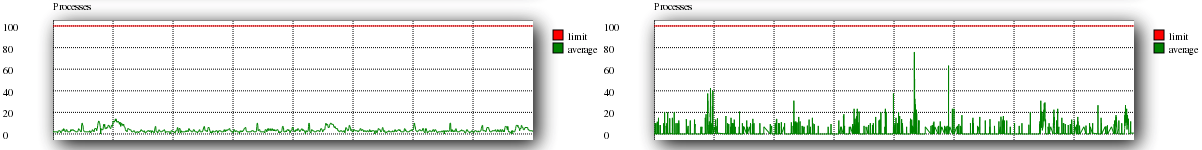
As you can see, the graph on the right is spiking more than it should be. This can be due to a number of reasons. Mainly, it is due to badly optimised code or too many visitors.
Faults
The fault graph compiles statistics for each of above graphs into a singular space, to help you quickly identify where your problem issue lies.
Both good and bad graphs are shown below.
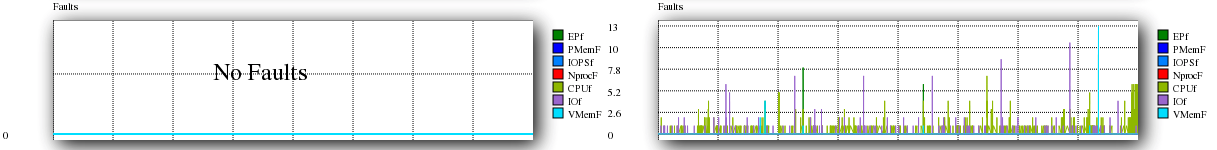
Good graphs should contain no faults, implying that no error threshold has been reached during the allotted time period. Bad graphs on the other hand may be rife with errors, and will show you at what time these problems have arised (utility of this time can help you monitor your logs to find what may have caused these issues). Once you know where the problem is arising from, you can check the other graphs to see if you can find a solution.
Solving Problems
Typically LVE’s utility will be to provide you with an overview for when, and what type of traffic is occurring during a time period. Smart analysis of the graphs however, can help you diagnose where issues may be occurring on your account.
Issue:
Excessive throttling across all sections.
Solution:
Typically, if you are experiencing excessive throttling across the board, it may indicate that your account is hosting too many busy domains.
Creating a separate account and migrating a domain across will split your resource allocation, allowing for a better spread of your resources.
Enabling error and transfer logging can provide you with a decent means to identifying excess use.
Issue
Excessive I/O Usage
Solution
Excessive usage can be alleviated through the correct use of caching. Caching pages and resources that are accessed a lot can reduce disk usage significantly.
Issue
High Virtual Memory Usage
Solution
The main reason behind high virtual memory usage is the excessive use of PHP processes; Checking for any applications that are using excessive memory can point you in the right direction as to what may be using too much virtual memory.

Classification: Public
Last saved: 2021/05/13 at 13:04 by Jamie